Select a wide range of Financial assets, compute and compare yearly returns, rolling correlations and correlation heatmaps — fast and interactively.
Powerful analytics, friendly UI
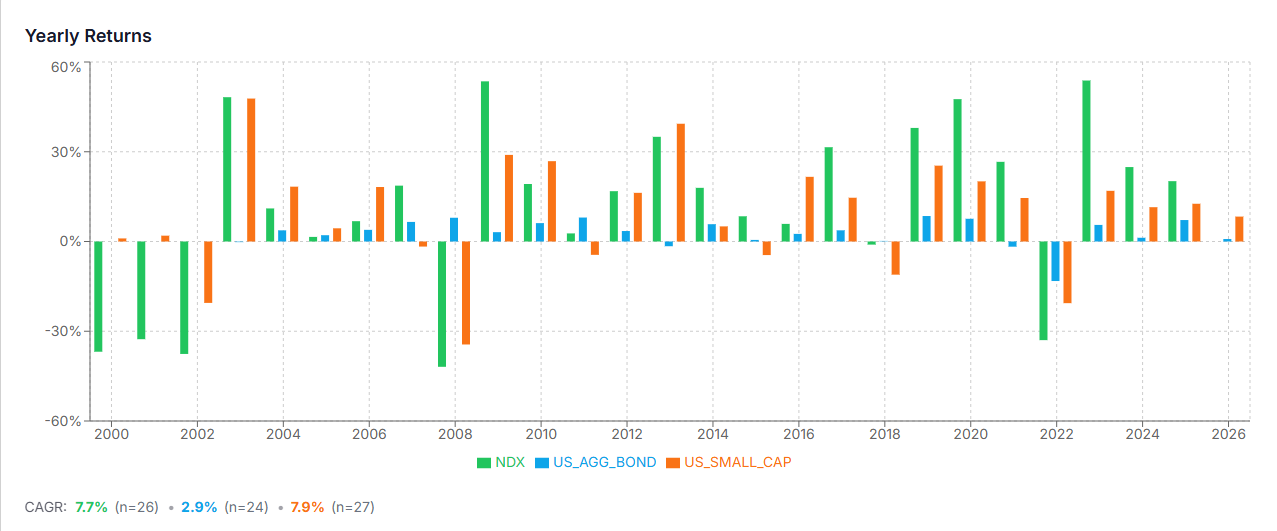
Compute compounded monthly and aggregated yearly returns per asset.
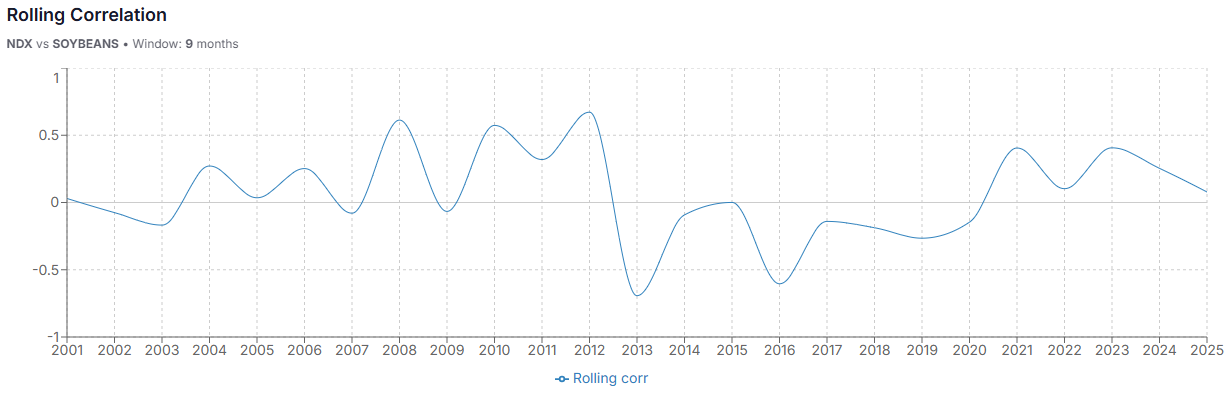
Flexible rolling-window correlations (months) with per-year sampling.
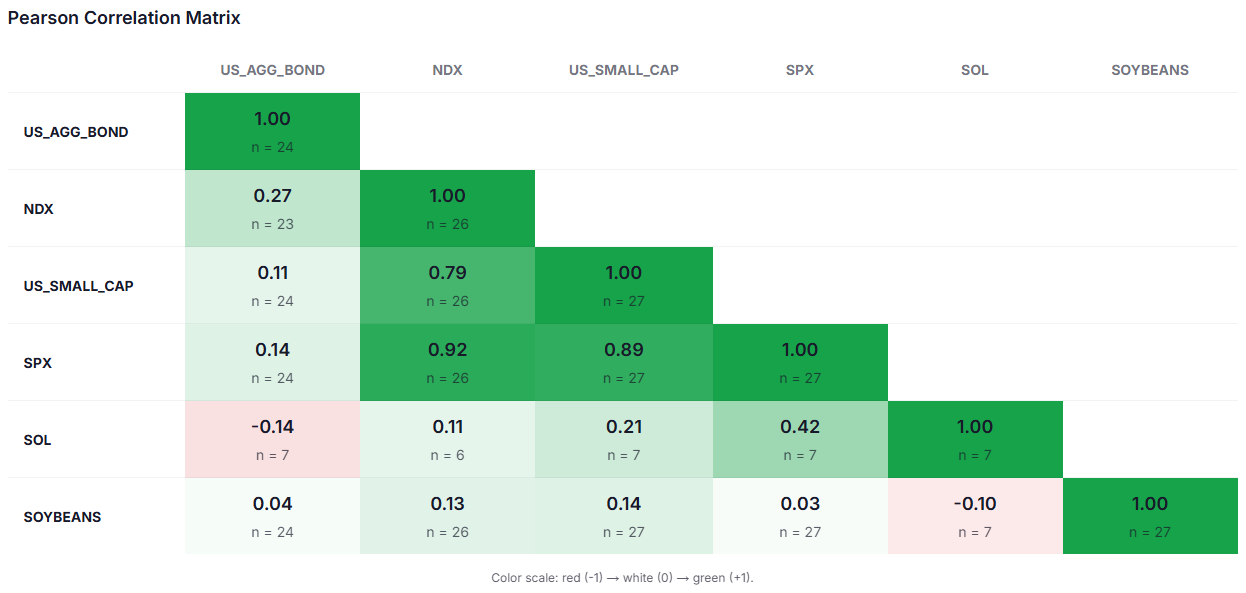
Visualize pairwise correlations and data overlap in a heatmap.
Open the interactive dashboard to explore real computations.
Open the dashboard, select assets, and run computations in seconds.